

How do you make business sense of ESG, Sustainable Development, and similar concepts?

For this month's e-newsletter, I decided to update what I knew about the Balanced Scorecard and share what I learned with you. My research took me down many paths – many with dead ends – so I'll share only the “winning” content.
I am deliberately taking a high-level approach in this e-newsletter, to help you better see the way concepts and terms fit together.
The Balanced Scorecard
This tool, developed in the early 1990’s by Robert Kaplan and David Norton, is explained in detail in their 1996 book, The Balanced Scorecard: Translating Strategy Into Action. The problem the authors were trying to address is this – in large companies, the main performance metric driving business decisions was quarterly Earnings Per Share (EPS). What was wrong with this measure?
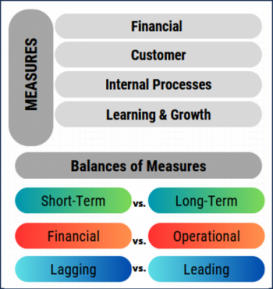
- It is a Short-Term measure.
- It is a Financial measure.
- It is a Lagging measure, meaning that it reports what actually happened, as opposed to a leading measure used to forecast what will happen.
To address these issues, the authors proposed tracking Measures across four major functions – Financial, Customer, Internal Processes, and Learning and Growth – inside a business, and using appropriate Balances of Measures across these functions:
These measures did achieve a more balanced reporting of business results and outlook, yet created another problem. Companies were producing reams of metrics instead of a well-chosen smaller set of metrics.
For a good explanation of the Balanced Scorecard concepts, here's a useful blog post – Everything You Need to Know About the Balanced Scorecard.
The Strategy Map
To address this new issue of too many metrics, the same authors developed – in the late 1990’s and early 2000’s – a framework to help place measures in the overall business context. This figure is based on one in their 2004 book, Strategy Maps: Converting Intangible Assets into Tangible Outcomes:
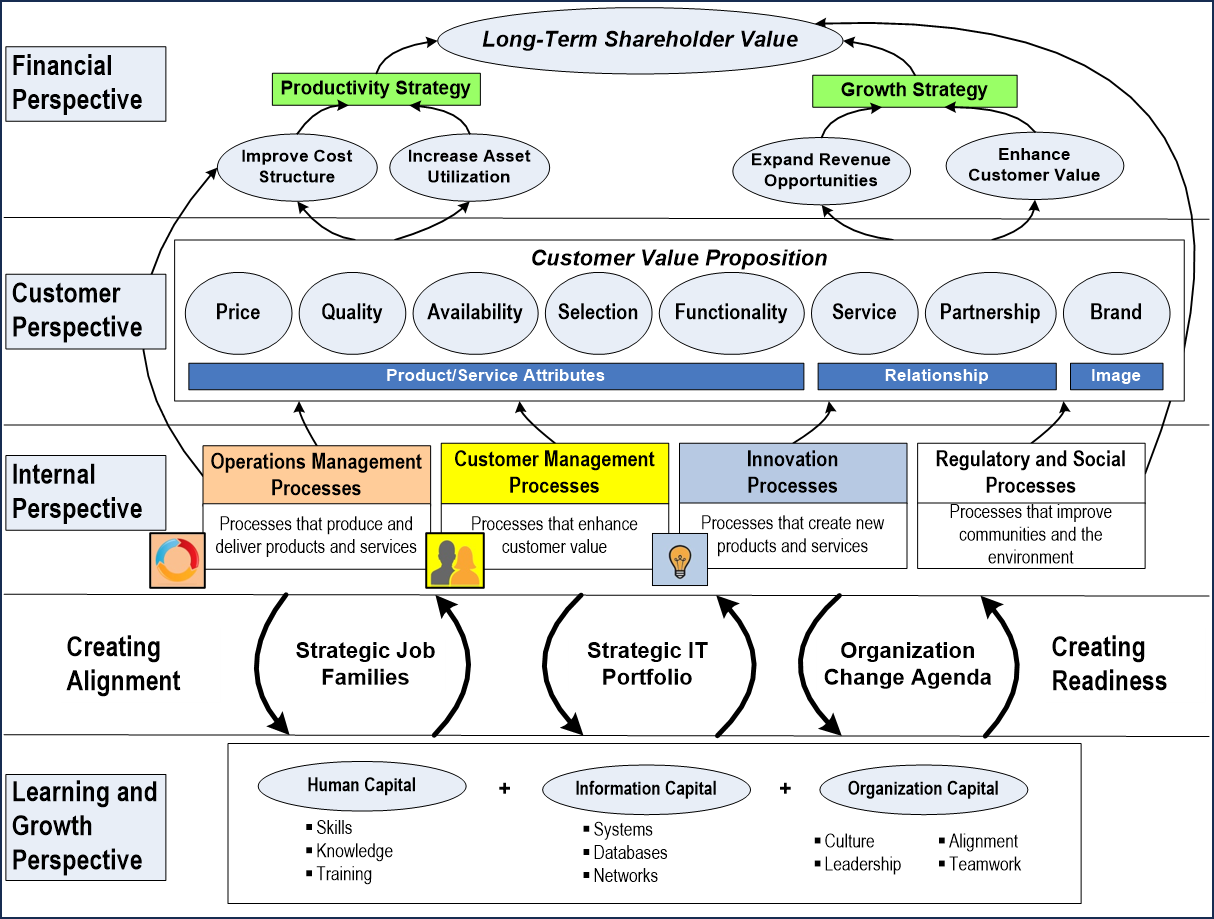
The idea here is to work from the bottom, Learning and Growth Perspective, and make various linkages as you move up in the diagram.
- Providing Learning and Growth opportunities help develop your key intangible assets – Human Capital, Information Capital, and Organization Capital – so they can help create alignment with your Internal Perspective.
- Addressing your Internal Perspective by constantly improving these Processes that run the business, which helps determines the Customer Perspective.
- Exploring the Customer Perspective helps you understand how your customer experiences the company's products, services, and relationships to finally yield the Financial Perspective.
- Measuring and reviewing the Financial Perspective helps you assess and refine your productivity and growth strategies, and continue delivering Shareholder Value.
Notice that the Balanced Scorecard's major functions of a business are shown in rectangles on the left side of the diagram. Using its Strategy Map, a company would define a small set of measures (no more than a dozen) to help steer the company towards its strategic goals.
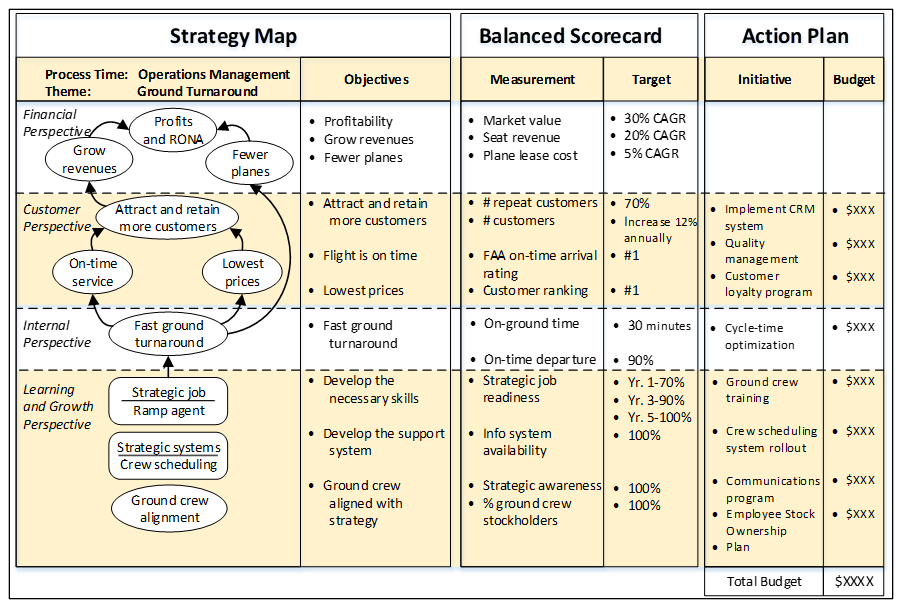
The diagram above shows all the detail that could go into a Strategy Map. In practice, only a small subset of this appears on an actual one. The Strategy Maps book includes this example for a large special project undertaken by an airline:
For a good explanation of the Strategy Map concepts, here's a useful blog post – What Is a Strategy Map?
A Lot Has Changed Since the 1990’s
The Strategy Map worked well for many years – however, when researching its current state as well as that of the Balanced Scorecard, I found many articles whose authors believed these concepts needed to be expanded to take into account relatively new Environmental, Social, and Governance (ESG) and Sustainable Development considerations.
These are laudable new items to track, yet how do you begin to develop meaningful measurements of these overwhelming areas?
Interestingly, one major company started pursuing measurements for ESG and Sustainability in the late 1990s – the Anglo-Dutch energy company, Shell. Furthermore, one particular business sector jumped on this bandwagon early, the Financial sector.
Shell's Sustainability Report for 1997 and Triple Bottom Line
When I came upon Shell's Sustainability Report for 1997, I was impressed by the many forward-thinking concepts it contained. Among these was a section written by John Elkington, the developer of the Triple Bottom Line (TBL). Here are some excerpts from that report:
“If sustainable development is to become a global reality rather than remain a seductive mirage, governments, communities, companies and individuals must work together to improve their ’triple bottom line’ (environmental, social and economic) performance. To this end, we not only need new forms of accountability but also new forms of accounting. ...
“At the heart of the emerging sustainable value creation concept is a recognition that for a company to prosper over the long-term, it must continuously meet society’s needs for goods and services without destroying natural and social capital. The approach does not necessarily imply a new concept of what companies are primarily for; rather, it extends the time-horizon over which the full range of a company’s – and its shareholders’ – interests should be assessed.” [Emphasis added]
These are summaries of the three bottom lines from the same 1997 Shell Sustainability Report:
- Environmental Value Added, or Natural Capital – “We must adjust our measurements of wealth creation and profit with a charge for the natural capital employed – and, in the case of non-renewable resources, often consumed for a one-off benefit.”
- Social Value Added, or Human Capital – “The ultimate bottom line for any project or business must also be adjusted for impacts on human and social capital. In the case of human capital, we must account for knowledge and skills developed or lost. In the case of social capital, the focus might be on the levels of resilience, mutuality and trust in communities, be they villages, mega-cities or world regions.”
- Economic Value Added, or Financial Capital – “Shell focuses on ’Return on Average Capital Employed’ (ROACE), but another approach – ’Economic Value Added’ (EVA) – is promoted by US investors [asking] whether given companies or industries are adding or destroying value. The profits a company makes are adjusted for the costs of the capital employed.”
When business people speak of the “bottom line,” they usually mean a company's Net Income, since it is the last line on the Income Statement. The Economic Bottom Line is actually broader than just Net Income, because it focuses on value creation, as measured by Economic Value Added (EVA).
Of the three bottom lines, only the economic one is currently measured in currency. The other two may eventually be dollarized – even so, I imagine it will be decades before Environmental or Social measures become more than supplemental information to a company's annual financial statements.
Amalgam Bank's 2022 ESG Summary and the UN's Sustainable Development Goals
As I mentioned earlier, the financial sector – specifically, banking – was an early adopter of ESG and Sustainability concepts. In fact, the Global Alliance for Banking on Values (GABV) was founded in 2009 to bring together, and provide support to, like-minded banks as they began putting these concepts into practice. There were a number of US banks on the GAVB's Members page, so I picked one to review. Amalgam Bank's ESG Summary report for 2022 was impressive in the way it succinctly presented its measures, along with honest commentary on how the bank was progressing on its journey. I found their “Employee Retention” – a Social Capital goal – self-assessment both interesting and brutally honest:
“In 2022, our regrettable voluntary turnover was 15% (employees who met performance expectations who chose to leave), non-regrettable voluntary was 7% (employees who were rated poorly and/or with whom we had active performance-improvement-needed discussions), and our involuntary turnover was 7.5%.” [Emphasis added]
While every business has to deal with under-performing employees, I'd never before heard the terms “regrettable turnover” and “non-regrettable turnover” – and I never imagined they would be in a public document.
Amalgam also had a table in the back where it linked its areas of focus to the 17 United Nations' Sustainable Development Goals (SDG's). Here's the first row in that table:
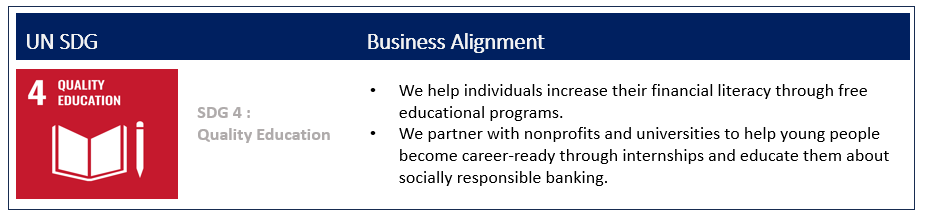
| The Dimensions of Sustainability and Relevant SDGs | ||||||
| Environmental | ||||||
 |
 |
 |
 |
|||
 |
 |
|||||
|
||||||
| Socio-economic | ||||||
 |
 |
 |
 |
|||
 |
 |
 |
 |
|||
 |
 |
 |
||||
|
||||||
Hopefully, between the UN and the ICC, these concepts will become more widely known globally.
Pulling Things Together
I've taken you on a long and winding journey, so let me summarize how I see all these concepts fitting together:
- All these concepts broaden the focus of a business from only Shareholders to more-inclusive Stakeholders – owners, banks, employees, customers, vendors, and various communities affected by a business.
- The ESG factors can be placed in the Regulatory and Social Processes under the “Internal Perspectives” area of both the Balanced Scorecard and the Strategy Map.
- The Triple Bottom Line (TBL) shepherds everything together into three functional areas – Environmental, Social, and Economic.
- Sustainable Development looks at the alignment of the TBL functional areas over time. If these factors are wildly out of balance with each other, the company will not succeed in the long-term – a business must be sustainable for it to meet the ongoing needs of its stakeholders.
- Governance provides the structure by which business is conducted, relationships with Stakeholders – including Shareholders – are handled, and measurements are taken and reported.
I recently heard a financial advisor discuss ESG mutual funds versus general mutual funds – his overall conclusion was that ESG funds screen well on the same factors that good general funds do. Why? Because the companies in both types of funds are well-run profitable entities.
The title of Shell's Sustainability Report for 1997 is “Profits and Principles – does there have to be a choice?” Based on the financial advisor's comments, and the concepts and techniques discussed here, I believe you can successfully balance both profits and principles.
Given the scope of this topic and my deliberate attempt to keep this article as concise as possible, I'm sure many readers will have questions. As always, feel free to reply to this e-newsletter with your questions and comments.
Sincerely,

Todd L. Herman
Stay tuned for our upcoming video on - Rethinking Your Business Metrics to Include ESG Factors